If you’ve ever found yourself drowning in a sea of console.log statements, you know the feeling. It’s like trying to navigate a maze blindfolded. Sure, a log can tell you if you hit a certain point in your code, but it offers zero context about the why or the how. That’s where a dedicated React Native Debugger comes in—it’s not just a tool, it’s a complete command center for your application.
This isn’t just about adding another tool to your belt. It’s about fundamentally changing how you build and debug, combining the power of Chrome DevTools, a UI inspector, and Redux DevTools into one seamless experience. It gives you the deep visibility you need to build apps that are not just functional, but truly stable and performant.
Why Your App Needs More Than Console Log

Let’s be honest, we’ve all been there—staring at an endless terminal output, trying to piece together a story from fragmented log messages. While console.log is a trusty old friend, it provides a flat, one-dimensional view of a dynamic, multi-layered application.
Modern React Native apps are a complex dance of state management, deep component trees, and tricky asynchronous calls. When a Redux action triggers an unexpected UI flicker, a simple log just won’t cut it. You’re left scattering more logs throughout your code, hoping to catch the culprit. It’s an inefficient, frustrating cycle of adding, testing, and then forgetting to remove them.
Moving Beyond Guesswork
A proper React Native Debugger flips the script, turning random guesswork into a methodical investigation. It lets you hit pause on your app’s execution at any moment, inspect the exact value of every variable, and walk through your code line by line.
This is a game-changer in a cross-platform world. Since Meta released it back in 2015, React Native has grown to command around 42% of the market share for building apps from a single codebase. Many projects boast over 70% code reuse between iOS and Android, so having a diagnostic tool that works consistently across both platforms isn’t just a nice-to-have; it’s essential.
A dedicated debugger doesn’t just help you fix bugs faster. It helps you understand your application’s behavior on a fundamental level. It’s the difference between patching a symptom and curing the underlying disease.
The Benefits of an Integrated Toolkit
The true magic of the React Native Debugger is that it brings everything together. Instead of jumping between different windows for state, UI, and network traffic, you get a single, unified dashboard.
- Inspect UI Elements: Instantly see styling properties, dimensions, and component layouts.
- Monitor State Changes: Watch your Redux or MobX store in real-time and even time-travel through state changes.
- Analyze Network Requests: Inspect API calls, headers, and responses without needing a separate proxy tool like Charles or Fiddler.
This integrated approach eliminates the constant context-switching that drains productivity and focus. After all, effective debugging is a cornerstone of a smooth workflow. For a deeper dive into boosting team efficiency, check out these strategies for improving developer experience.
And remember, while a solid debugging setup is your first line of defense, some bugs will inevitably make it to production. When they do, you’ll want to be prepared. For that, take a look at our guide on the best tools for mobile app crash reporting: https://codepushgo.com/blog/mobile-app-crash-reporting/
Your Initial Setup and Configuration
Getting the React Native Debugger up and running is one of those small time investments that pays off big time in productivity. Before we jump in, I’m assuming you already have a working React Native development environment set up. If you’re brand new to the scene, our guide on getting started with React Native is a great place to build that foundation first.
With your environment ready, installing the debugger is usually just a single command. It’s a standalone app available for macOS, Windows, and Linux. If you’re on a Mac and use Homebrew, you’re in luck—it’s about as simple as it gets. Just pop open your terminal and run this:
brew install --cask react-native-debugger
That one line will grab the latest stable version and stick it right in your Applications folder. For my Windows and Linux friends, you’ll just need to download the correct release directly from the official GitHub repository.
This infographic gives you a bird’s-eye view of the entire flow, from checking the basics to getting your project configured.
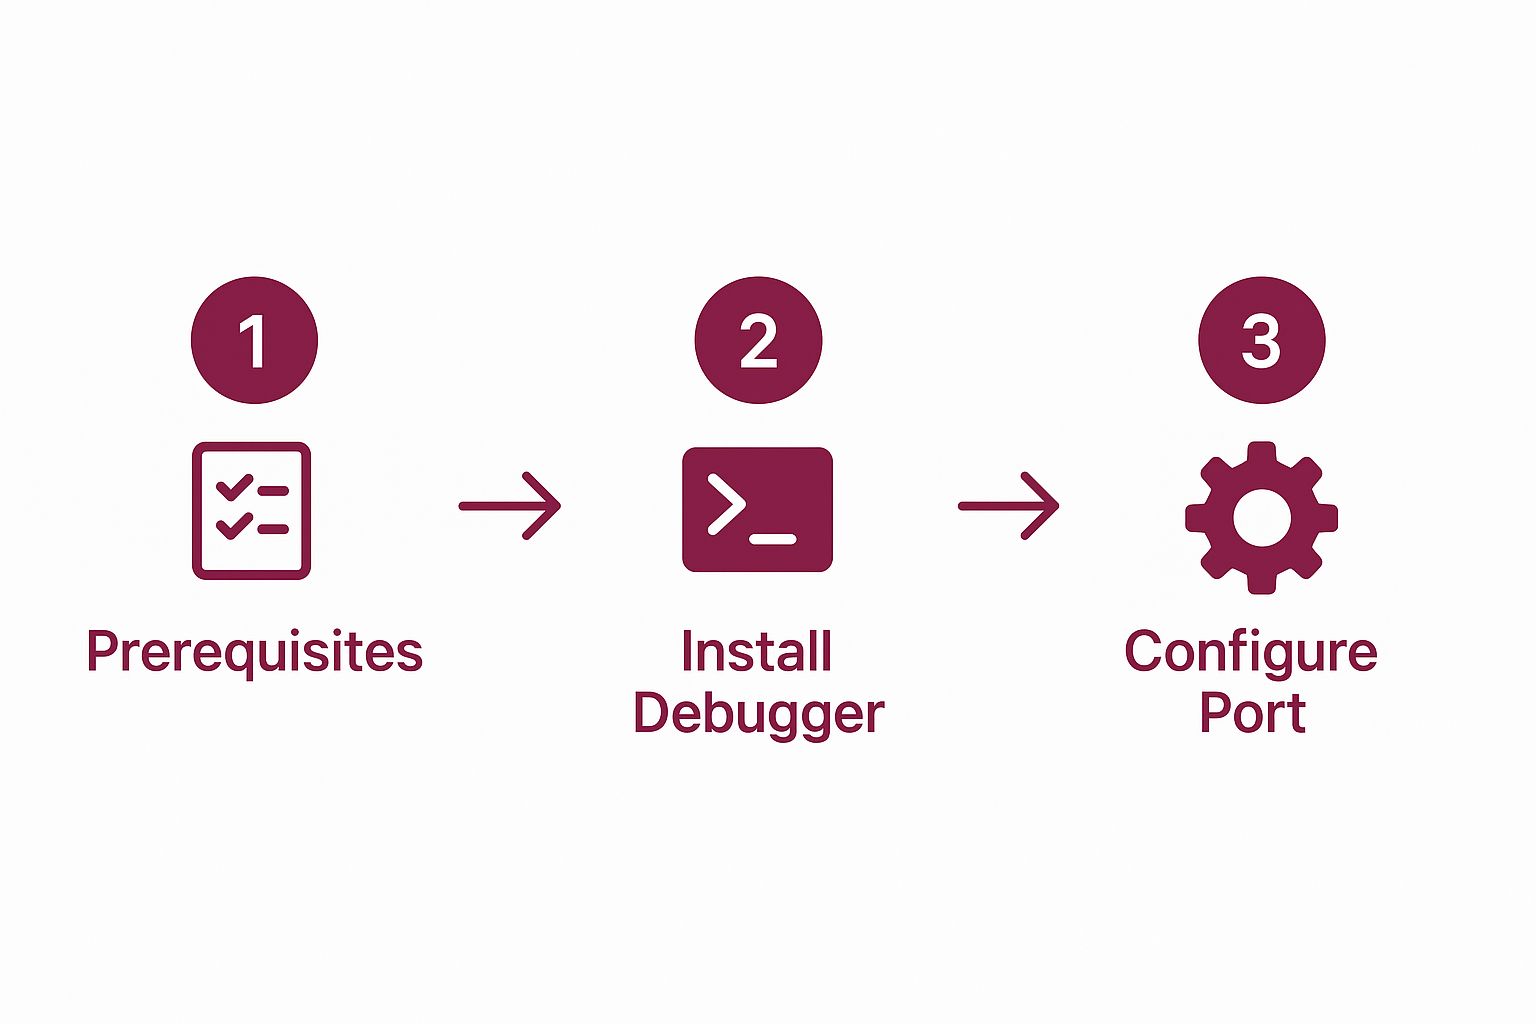
As you can see, it’s a straightforward path. No weird detours or complex configurations, which makes it perfect even if you’re just starting out.
Connecting the Debugger to Your App
Okay, so you’ve got the application installed. Now for the crucial part: telling your React Native app how to talk to it. This connection is made over a network port, which by default is 8081. The moment you launch the React Native Debugger app, it’s already listening on that port, waiting for your app’s Metro bundler to say hello.
To get the two connected, here’s what you do:
- Fire up your app. Run it on a simulator, emulator, or a real device, just like you normally would.
- Open the developer menu. On a physical device, just give it a good shake. On a simulator, you can use the keyboard shortcuts:
⌘Dfor iOS or⌘Mfor Android. - Hit “Debug”. You’ll see this option in the menu. Tapping it tells your app to connect to whatever is listening on that default port.
And that’s it! The React Native Debugger window will reload, and suddenly you’re looking at your app’s live JavaScript environment.
Handling Port Conflicts
One of the most common snags I see people hit is a port conflict. If you have another service on your machine hogging port 8081, the debugger simply can’t connect. Thankfully, this is an easy fix.
You can tell the debugger to use a different port right from the command line when you launch it. For example, you could assign it to port 9000. The key is to also tell your app to connect to that same new port. You can do this by setting the RCT_DEBUGGER_PORT variable before you kick off your Metro server.
Pro Tip: If you ever get a connection error, your first reflex should be to check for a port conflict. A quick look can save you a ton of frustration chasing a bug that isn’t even in your code. It’s a fundamental troubleshooting step that every developer learns, often the hard way
Getting to Know the Core Debugging Features
Alright, once you’re connected, you’ve essentially opened up a command center for your entire application. This is about more than just squashing bugs; it’s about truly understanding how data flows and components interact to bring your app to life. The real power here is how all these tools work together, giving you a complete picture of what’s happening under the hood.
We’ll start with what might be the most familiar territory for web developers: the Chrome DevTools interface. This is your go-to for hunting down pesky logic errors.
Pinpointing Logic Errors with Breakpoints
The most classic—and effective—debugging technique is setting a breakpoint. All you have to do is click a line number in the “Sources” tab, and your app will literally pause its execution the moment it hits that line. This is absolutely invaluable.
Imagine a user’s profile data isn’t updating correctly after they hit “save.” Instead of peppering your code with console.log statements, you can just set a breakpoint inside your updateUserProfile function. When the code freezes, you can hover over any variable to see its exact value at that moment. Is the userID what you expect? Is the newProfileData object structured correctly?
This methodical approach takes the guesswork out of debugging and lets you trace the flow of data, step by step. It’s a foundational skill, and having professional-grade tools like this is a key reason the React Native development market is projected to hit nearly $499 million by 2031.
Inspecting and Tweaking the UI in Real Time
Next up is the UI Inspector, an absolute game-changer for anyone who’s ever wrestled with styling and layout bugs. It’s built right into the debugger and lets you click on any component in your running app to see its complete style properties.
Let’s say a button is mysteriously pushed to the side on Android but looks perfect on iOS. Here’s how you’d tackle that:
- Select the Element: Just use the inspector tool to click on that rogue button in your app.
- Analyze the Styles: The “Elements” panel immediately shows you the component hierarchy and every single style applied—from
flexboxproperties topaddingandmargin. - Edit on the Fly: The best part? You can change these style values right there in the panel and watch the UI update in your app instantly. No more saving a file, waiting for a reload, and checking again.
This tight feedback loop can turn a frustrating 30-minute ordeal into a 60-second fix. For a deeper look at common issues, check out our guide on how to debug React Native apps.
The ability to see and manipulate the UI in real time is transformative. It changes your mental model from “writing styles” to “sculpting the user interface,” making the process more intuitive and creative.
The React Native Debugger is packed with features that streamline the entire development process. Here’s a quick breakdown of what you’ll be using most often.
React Native Debugger Feature Breakdown
| Feature | Primary Function | Best Used For |
|---|---|---|
| Chrome DevTools | JavaScript code inspection and debugging. | Setting breakpoints, logging variables, and analyzing performance. |
| React DevTools | Inspecting the React component hierarchy. | Checking component props, state, and finding component sources. |
| Redux DevTools | Visualizing and managing application state. | Time-travel debugging, inspecting actions, and tracking state changes. |
| Network Inspector | Monitoring all HTTP requests and responses. | Debugging API calls, checking headers, and analyzing response data. |
Each of these tools is powerful on its own, but their real strength comes from being integrated into a single, cohesive interface.
Visualizing State with Redux DevTools
If your application relies on a state management library like Redux, this integrated tool is a lifesaver. It gives you a complete, chronological log of every single action dispatched in your app.
When you’re trying to figure out why your state is in an unexpected condition, this is where you’ll look. While debugging JavaScript events that trigger these changes, you can click on any action in the log to see three critical pieces of information:
- The Action: The plain object itself, with its
typeandpayload. - State Diff: A clear “before and after” showing exactly what changed in your Redux store.
- Current State: The entire state tree after that action was processed.
The most celebrated feature here is “time travel.” You can literally click on past actions to revert your app’s state to that point in time, letting you replay user interactions to find the exact moment things went wrong.
Advanced Techniques for Power Users
So, you’ve gotten the hang of setting breakpoints and poking around in the component tree. That’s great, but now it’s time to really dig in and see what React Native Debugger can do. These are the strategies that will elevate the tool from a simple utility to an absolute essential in your daily workflow.
One of the most powerful, and often overlooked, features is the built-in Network Inspector. Forget firing up a separate proxy tool like Charles or Fiddler. You can watch every single HTTP request your app makes, right inside the debugger. This gives you a crystal-clear, chronological feed of all your API calls.
Just click on a request, and you get the full picture: headers, request payloads, and the complete JSON response. It’s a lifesaver for tracking down funky authentication tokens, spotting a malformed API request, or figuring out why the server is sending back something unexpected—all without switching contexts.
Customizing Your Redux Workflow
If you’re using Redux, the integrated DevTools are already a game-changer. But we can push it even further. Did you know you can create custom commands to automate parts of your debugging? This is all about dispatching special actions that only the DevTools will listen to, letting you trigger complex state changes on the fly.
Let’s say you’re deep inside a multi-step checkout flow. Testing an edge case on that final screen usually means clicking through the entire process over and over again. It’s tedious. Instead, you can create a custom action that jumps you directly to that state.
Here’s how you could set that up:
- Define a unique action type in your code, something like
DEBUG_SET_CHECKOUT_STATE. - Set up a reducer case that listens for this action and injects the exact data needed for that screen right into the store.
- Dispatch the action from the console in the debugger. Bam. Your app instantly teleports to the state you need to test.
This simple trick can save you an incredible amount of time, especially in large applications where getting to a specific state takes a lot of manual work.
Treating your debugging tools as a programmable environment is a complete shift in mindset. You stop being a passive observer and start actively shaping your app’s state for faster, more precise testing.
Debugging Over-the-Air Updates with CodePush
Things can get a little murky when you’re dealing with over-the-air (OTA) updates. When you push a new JavaScript bundle using a service like CodePush, you have to be confident it’s not going to break things for users. The good news is that React Native Debugger plays nicely with this entire process.
You can connect the debugger to your app right after it’s received a CodePush update and debug it just like any other build. This is absolutely critical for checking that your new code works with the existing native shell and that any state migration logic runs correctly.
This is a non-negotiable step in a solid deployment pipeline. After all, a huge part of effective React Native performance monitoring is making sure your updates don’t slow things down or introduce new bugs.
By making the debugger a core part of your OTA testing, you can catch update-specific issues before they ever reach your users. It’s the safety net that gives you the confidence to ship changes quickly and reliably.
Getting Past Common Connection Problems
Even with the smoothest setup, you’re bound to hit a snag connecting the React Native Debugger to your app at some point. It happens to all of us. These issues are usually small, but they can be a real headache if you don’t know where to start looking. Let’s walk through the usual suspects and get you back on track.
One of the most common blockers you’ll see is the infamous “Another debugger is already connected” message. This little gem usually pops up when you have a forgotten Chrome DevTools tab running from a previous session or a process that didn’t fully shut down. The fix is often refreshingly simple: just close out all your debugging-related browser tabs and give both the debugger app and your Metro bundler a complete restart.
Fixing Port Mismatches
Another classic problem I see all the time is a port mismatch. By default, both React Native Debugger and Metro expect to communicate on port 8081. If you have another service on your machine—like another dev project—already squatting on that port, the connection will just fail silently. You’ll be left scratching your head, wondering why nothing is working.
The good news is you can tell the debugger to use a different port when you launch it. For example, you could assign it to port 8083. The critical part, though, is that you also have to tell your app’s Metro bundler to use that same new port. This ensures both ends are listening to the same conversation.
The key takeaway here is that the debugger and Metro absolutely must be on the same port. If you change one, you have to change the other. This simple check solves a massive percentage of connection failures I’ve encountered.
Mastering these tools is more important than ever. React Native has become the top non-native framework on the Apple App Store and is second on the Google Play Store. Its market share for new apps has jumped from 4.73% to 6.75%, according to recent cross-platform development trend data. This explosive growth means more developers than ever are relying on tools like React Native Debugger every single day.
When the UI Inspector Fails to Inspect
Sometimes the weirdest things happen. The main debugger connects just fine, but the UI Inspector flat-out refuses to select any elements on the screen. It can be a real puzzle.
This is almost always a versioning issue. The React DevTools version bundled inside the debugger has likely fallen out of sync with the React version in your project. Here’s what to do:
- Check for Updates: First things first, make sure you’re running the latest version of React Native Debugger. The developers are constantly shipping updates that fix these kinds of compatibility quirks.
- Clear All the Caches: When in doubt, clear it out. Run
watchman watch-del-allin your terminal, then restart Metro with a clean slate usingnpm start -- --reset-cache. This forces a fresh build and often shakes out the issue.
It’s also worth noting that other debugging tools can sometimes interfere. If you happen to be running Flipper at the same time, try closing it to see if it’s causing a conflict. If you’re curious about how Flipper fits into the ecosystem, you can learn more about Flipper in our detailed articles. Following these steps should help you iron out those frustrating connection problems and get back to what matters: building your app.
Answering Your React Native Debugger Questions
When you’re trying to get a new tool up and running, a few questions always pop up. Let’s tackle some of the common ones I hear from developers working with the React Native Debugger.
Does This Work with Expo Go?
Yes and no. It’s a common point of confusion, so let’s clear it up.
The React Native Debugger hooks into your project’s Metro bundler. This works flawlessly if you’ve built a custom development client or started your project with a command like npx create-expo-app.
However, you cannot use it with the public Expo Go app from the app store. Expo Go is a pre-built binary, and a dedicated debugger needs to be part of a custom native build to connect properly.
Is This the Same Thing as React Native DevTools?
They’re related, but they are definitely not the same tool.
With the release of React Native 0.76, the official debugging experience shifted to the new React Native DevTools. This is a more modern, integrated tool built directly by the core team. Think of it as the new standard.
The standalone “React Native Debugger” you’ve probably seen is a fantastic open-source project that cleverly bundles Chrome DevTools, React DevTools, and Redux DevTools into a single desktop app. It’s been a go-to for years, but the community is gradually moving toward the official DevTools for a smoother, more stable experience.
The Bottom Line: The standalone React Native Debugger is a powerful community-built tool. The new, integrated React Native DevTools is the official successor and the future of debugging in the ecosystem. Both are designed to help you inspect your app, just in different packages.
Help! All I See Is a Blank Screen. What Gives?
Ah, the classic white screen of death. If the debugger launches but shows nothing, it’s almost always a failed connection.
Nine times out of ten, this is a simple port mismatch. Your app’s Metro server and the debugger need to be talking on the same port, which is usually 8081 by default. If you’ve configured one to use a different port, you have to update the other to match.
The quickest fix? Shut down both the debugger and your Metro instance, then restart them. That usually clears up any connection issues right away.
Ready to ship updates and fixes faster than ever? CodePushGo lets you deploy over-the-air updates to your React Native app instantly, bypassing app store reviews. Secure, reliable, and built for agile teams. Learn more about CodePushGo.