
Your unit test results are so much more than a simple pass or fail. They’re a vital feedback loop, a direct line into your code’s health that helps you build better software, faster. At their most basic, these results give you concrete data on code behavior, catching regressions and confirming new features work as expected before they ever see the light of day in production.
Beyond Pass or Fail: The Value in Your Test Results

Too many teams fall into the trap of treating unit tests like a chore—just another box to tick before a pull request can be merged. But if you’re only looking for that green checkmark, you’re missing the point. The real power is hidden in the mountain of data your test suite generates over time. This data isn’t just noise; it’s a strategic asset waiting to be used.
When you make the shift to tracking and analyzing your test results, you stop being reactive. Instead of just putting out fires, you start spotting patterns and identifying weak points in your codebase. It’s a fundamental change that helps you build software that’s not just functional, but truly resilient and easy to maintain.
The Strategic Importance of Test Data
Think of your test results like a health chart for your app. A single test run tells you if you have a fever today, but looking at the results over months reveals powerful trends about your codebase’s overall well-being. By consistently digging into this data, you can:
- Hunt Down Flaky Tests: Uncover those frustrating tests that fail randomly. These often point to hidden race conditions or environment-specific issues that slowly kill your team’s trust in the test suite.
- Monitor Code Coverage Trends: As you add new features, is your test coverage keeping pace, or is it slowly eroding? Tracking this metric prevents you from unknowingly racking up technical debt.
- Measure Refactoring Impact: Did that big refactor actually improve things? Use test success rates and performance data to get a definitive, data-backed answer, ensuring you didn’t introduce subtle new bugs in the process.
This data-driven mindset is becoming the industry standard. The global market for unit testing tools was valued at a whopping USD 1.5 billion in 2023 and is expected to climb to USD 4.2 billion by 2032. This growth isn’t just about automation; it’s about the increasing demand for smarter, more insightful development workflows.
Key Takeaway: When you treat test results as a first-class dataset, you unlock insights that inform architectural decisions, help you prioritize technical debt, and ultimately empower your team to ship better features with more confidence.
Of course, gathering this valuable data starts with a solid testing strategy. To get your efforts organized from the get-go, check out our guide on how to build a successful plan: https://codepushgo.com/blog/how-to-create-test-plan/
Building a Solid React Native Testing Foundation

Before you can even think about generating test results, you have to get your foundation right. I’ve seen it countless times: a poorly configured testing environment quickly becomes a source of frustration, not a reliable safety net. For anyone working in React Native, that foundation almost always begins with Jest, the go-to testing framework for the ecosystem.
While a new React Native project gives you a basic Jest setup out of the box, you’ll need to add a few more tools to get it to a professional level. The real goal isn’t just to run tests; it’s to write tests that are easy to read, simple to maintain, and actually mimic how a real person uses your app.
That’s where a couple of specialized libraries come in. They fill the gap between what Jest does on its own and what you actually need to test a React Native component tree effectively.
Key Libraries for a Professional Setup
To build an environment that produces clear, actionable unit test results, there are two packages I always install first. These tools are designed to work together, making the whole testing experience far more intuitive.
@testing-library/react-native: Think of this as the cornerstone. It lets you render components in your tests in a way that encourages good practices. You’ll find yourself querying for elements just like a user would—by text content or accessibility labels—instead of digging into messy implementation details.@testing-library/jest-native: This library is the perfect companion, extending Jest with a set of custom matchers that make your assertions incredibly readable. Instead of writing a bunch of boilerplate, you can just writetoBeVisible()ortoHaveTextContent(). Simple.
Getting them installed is just a single command:
npm install --save-dev @testing-library/react-native @testing-library/jest-native
With those in your project, the next step is to let Jest know they exist.
Configuring Your Jest Environment
The jest.config.js file is the brain of your testing operation. A common and highly effective pattern is to create a separate jest.setup.js file specifically for importing the extended matchers from @testing-library/jest-native.
Just pop this line into your jest.config.js:
setupFilesAfterEnv: ['./jest.setup.js']
Then, inside that new jest.setup.js file, you only need one thing:
import '@testing-library/jest-native/extend-expect';
This one line makes all those powerful, readable matchers globally available across all your test files. No more repetitive imports. If you want a deeper dive, check out this guide on getting started with the React Native Testing Library. This simple setup ensures your tests stay clean and maintainable as your project grows.
A well-configured testing foundation is non-negotiable. It ensures your tests are reliable, readable, and focused on user behavior, leading to unit test results that provide genuine insight into your application’s quality.
Now you have a solid baseline to write meaningful component tests. For example, testing a login button becomes a simple process of rendering the component, simulating a press, and asserting that the right function was called. You’re validating the actual user interaction path, which is infinitely more valuable than just checking a component’s internal state. It’s this reliable setup that allows us to generate the powerful results we’ll dig into next.
From Raw Output to Actionable Test Reports

Watching tests pass in your terminal is a great start, but let’s be honest, that raw console output isn’t where the story ends. The real value is locked away inside that stream of text. To unlock it, you need to transform it into structured, portable data—turning a simple pass/fail signal into a rich source of analytics for your project’s health.
For any modern CI/CD pipeline or analytics platform to make sense of your tests, they need a standardized report format. The good news is that Jest has powerful, built-in capabilities to generate these reports directly. We’re not talking about complicated plugins, just simple command-line flags that put you in control of how your unit test results are packaged.
This simple shift from temporary console logs to persistent data artifacts is a game-changer. It’s the first step toward building a historical record of your code’s quality, allowing you to spot trends and make decisions based on data, not just gut feelings.
Generating Machine-Readable Reports
Two of the most universal and useful formats you’ll encounter are JUnit XML and JSON. JUnit is a long-standing standard that nearly every CI/CD tool, from Jenkins to GitHub Actions, can parse right out of the box to display test outcomes. JSON, on the other hand, gives you incredible flexibility for custom scripting or feeding data into analytics platforms like CodePushGo.
You can tell Jest to generate these formats using the --reporters flag. For instance, if you want to see the standard console output while also creating a JUnit XML file, your command would look something like this:
npx jest --reporters="default" --reporters="jest-junit"
For complete control, you can use flags like --json combined with --outputFile. This lets you pipe a full summary of the test run into a specific file, which is perfect for creating a clean data source for other tools to consume. Mastering these outputs is a core part of getting the most from the Jest testing framework.
By 2025, the software testing industry is projected to reach USD 48.17 billion, with automation replacing at least 50% of manual testing for nearly half of development teams. This highlights a massive industry shift towards data-driven quality assurance.
To help you choose the right reporter for the job, here’s a quick rundown of some common options you can configure in Jest.
Jest Reporter Configuration Options
| Reporter | Configuration Flag | Output Format | Primary Use Case |
|---|---|---|---|
| Default | default | Console/Terminal | Immediate feedback during local development. |
| JUnit XML | jest-junit | XML | Integration with CI/CD systems like Jenkins, CircleCI, or GitLab. |
| JSON | --json | JSON | Feeding test results into custom dashboards or analytics platforms. |
| Verbose | --verbose | Console/Terminal | Detailed, test-by-test breakdown in the console. |
Each reporter serves a different purpose, whether you’re quickly checking tests on your machine or archiving results in a formal pipeline.
Demystifying Code Coverage Reports
Knowing your tests passed is one thing. Knowing what you actually tested is another entirely. That’s where code coverage comes in—it tells you exactly which lines, functions, and branches of your code were executed during the test run.
And with Jest, generating a detailed coverage report is incredibly simple.
Just add the --coverage flag to your test command:
npx jest --coverage
Running this creates a coverage/ directory right in your project root, which contains a beautiful, interactive HTML report. Pop open the index.html file in your browser, and you’ll get a file-by-file breakdown of your application’s test coverage.
You can drill down into individual files and see, line by line, which code paths are covered and—more importantly—which ones are being missed. This visual feedback is one of the fastest ways to find critical gaps in your test suite, helping you focus your efforts where they’ll have the most impact.
Automating Test Reporting in Your CI/CD Pipeline
Running tests on your local machine is a great start, but the real magic happens when you bring automation into the mix. To get the most value from your unit test results, you need them generated, collected, and archived with every single code change. This is where your Continuous Integration/Continuous Delivery (CI/CD) pipeline becomes the backbone of your quality assurance.
Plugging your Jest test suite into a CI/CD workflow means no code gets merged without passing a crucial quality check. It transforms testing from a manual, sometimes-skipped step into a mandatory, automated process. This not only saves a ton of time but also enforces consistency, making sure every pull request is held to the same high standard.
The concept is beautifully simple: a developer pushes a commit, the pipeline kicks off, it runs your tests, and reports back. This diagram really brings that essential feedback loop to life.
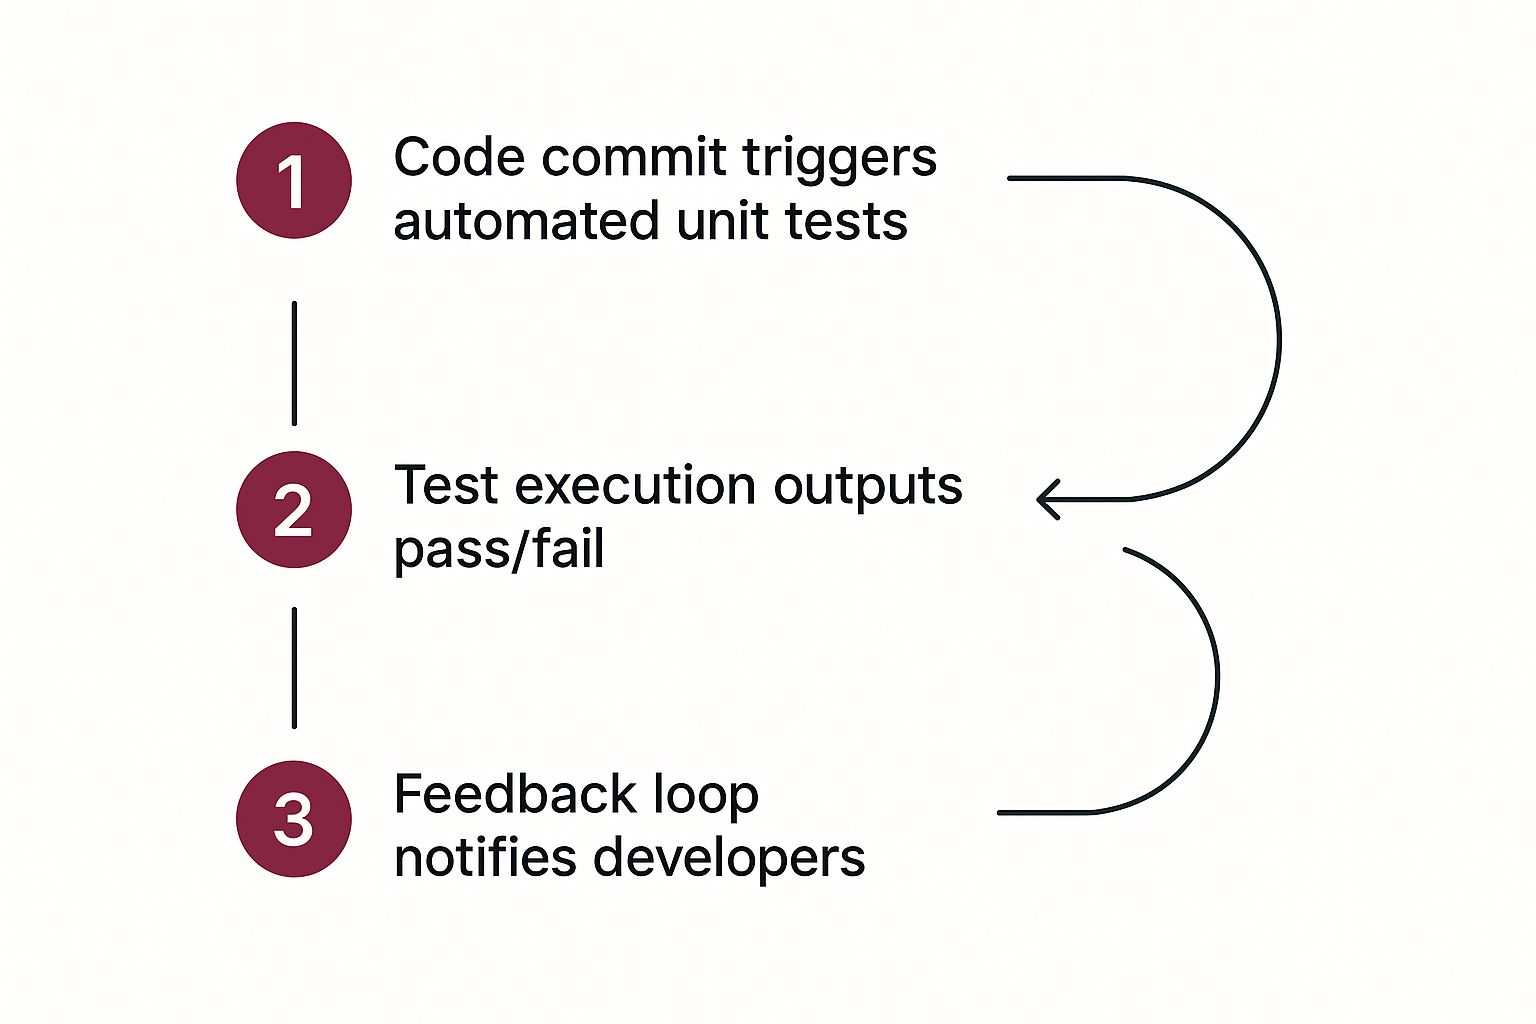
This flow provides an immediate, automated sanity check on every contribution, weaving the test results directly into the fabric of your code review process.
Implementing Test Automation With GitHub Actions
If your team is on GitHub, getting this set up with GitHub Actions is surprisingly straightforward. All you need is a YAML file in your repository that lays out the exact steps to install dependencies, run your tests, and save the output. Think of this file as the blueprint for your automated quality gate.
A standard workflow usually boils down to a few key jobs:
- Checkout Code: Grabs the latest version of your branch and pulls it into the runner environment.
- Setup Node.js: Installs the specific Node.js version your project needs to run.
- Install Dependencies: Runs
npm installoryarn installto fetch all the required packages. - Run Tests: Kicks off your Jest test script, which should be configured to generate a JUnit report for easy parsing later.
- Archive Artifacts: This is a big one. It takes the test reports and coverage files and saves them as downloadable artifacts tied to that specific workflow run.
That last step is critical. By archiving artifacts, you’re creating a permanent record of test outcomes for every single commit. This history is invaluable when you’re trying to track down a regression or just analyze trends over time.
The real point of CI is to build a reliable, repeatable process. When test reporting is automated, you eliminate human error and guarantee that every developer gets the same fast, consistent feedback on their code.
Integrating Results With a Jenkins Pipeline
For teams running a self-hosted Jenkins server, the principles are the same, even if the implementation looks a bit different. You’ll be working with a Jenkinsfile and leaning on a few helpful plugins. Jenkins gives you a ton of flexibility to build out complex pipelines for more advanced testing and deployment strategies.
A very common approach is to use the Jenkins JUnit Plugin. This plugin was built for one job: parsing the JUnit XML reports you told Jest to create. Once it processes that file, it gives you a fantastic summary of the unit test results right inside the Jenkins UI. You can see trends, pinpoint failing tests, and dig into specific error logs without ever leaving your dashboard. To get a better handle on how this fits into the bigger picture, you can learn more about the fundamentals of testing in continuous integration.
Your Jenkinsfile script would define stages for checking out code, building the project, and then a dedicated stage just for running tests. It might look something like this:
stage(‘Test’) { steps { sh ‘npm test — —reporters=default —reporters=jest-junit’ } post { always { junit ‘junit.xml’ } } }
This little snippet tells Jenkins to execute the test script and then—no matter what—to always look for a file named junit.xml and process the results. And if you’re looking to really speed things up, check out a guide to testing in parallel for some advanced strategies to slash your test execution times.
Visualizing Test Data to Find Hidden Insights
Raw JUnit or JSON files are a great start, but let’s be honest—they’re just data points. They don’t tell you the whole story. To really understand the trends, recurring problems, and the true quality of your project, you have to bring that data to life with visualization. This is where you’ll see the payoff from tracking your unit test results over time.
When you turn raw output into interactive dashboards, you shift from a reactive “fix-what-just-broke” mindset to a proactive one. Instead of just staring at a single test run, you can start asking the bigger, more important questions. Are our tests getting slower? Is a specific part of the app a magnet for flaky tests? Is our code coverage really improving with each new feature?
Answering those questions is what separates the good teams from the great ones.
Turning Numbers into Narratives
This is exactly what tools like CodePushGo are built for. Think of it as a central hub where all the test result artifacts from your CI/CD pipeline land. Once the data is in, the platform automatically crunches the numbers and displays everything in easy-to-digest dashboards and charts. Suddenly, complex trends become obvious.
For instance, a good dashboard can consolidate all your test analytics, showing success rates and recent activity at a glance.
This kind of visual summary gives you far more context than any single report file ever could. You see the key metrics immediately without having to dig through logs.
By consistently feeding your test results into an analytics platform, you build a historical record of your app’s health. This is how you spot patterns that are otherwise invisible, like a slow dip in test success rates after a major library upgrade or a spike in failures that lines up perfectly with a specific feature branch. For a deeper dive into making your charts clear and impactful, check out these essential data visualization best practices.
Key Metrics to Monitor in Your Dashboards
Once you have data flowing in, don’t get overwhelmed. Focus on a few critical metrics that give you the most bang for your buck. These will provide a solid, high-level view of your project’s quality and stability.
- Test Success Rate Over Time: This is your North Star. A consistently high success rate—think 99% or more—points to a healthy codebase. If you see that number trending down, it’s an early warning that technical debt or instability is creeping in.
- Identification of Flaky Tests: Flaky tests are notorious for destroying a team’s trust in their test suite. A good analytics tool will flag tests that pass and fail intermittently without any code changes, pointing you directly to the source of the problem.
- Code Coverage Trends: Don’t just look at the coverage number from a single run. You need to track it across releases. A steady increase is great, but a gradual decline is a major red flag that testing standards are slipping as new code is added.
- Test Duration Analysis: Are your tests taking longer to run? Monitoring execution time helps you pinpoint bottlenecks in your test suite, which is crucial for keeping your CI/CD pipeline fast and efficient.
Key Takeaway: Visualizing your unit test results creates a powerful feedback loop. It turns isolated data points into a continuous story about your code’s quality, giving you the power to make smarter, data-driven decisions.
This level of insight is a pillar of any mature DevOps practice. To see how this fits into a bigger picture, it’s worth exploring the different monitoring tools for DevOps.
Wrestling with Your React Native Test Results? Here’s What I’ve Learned
So, you’ve got your testing pipeline up and running. Reports are being generated, and things are looking good. But now comes the hard part: making sense of it all. It’s one thing to get data; it’s another thing entirely to use it to make your app better.
Let’s break down some of the most common questions and challenges that pop up once you start digging into your test results.
What’s a “Good” Code Coverage Percentage, Really?
Everyone always asks for a number. The industry standard that gets thrown around is 80%, but honestly, that number can be a trap. Context is king. Chasing a high percentage without considering what you’re testing is a classic rookie mistake.
Think about it this way: are you thoroughly testing your critical business logic, the complex functions that could bring everything crashing down? That’s what matters. I’d much rather have 100% coverage on my app’s core logic and a lower percentage on simple, low-risk UI components than the other way around.
The big takeaway here is to avoid letting code coverage become a vanity metric. A test suite with 70% coverage that rigorously validates your most important code is infinitely more valuable than a 95% suite that just checks if a bunch of buttons render.
How to Deal With Those Dreaded Flaky Tests
Ah, flaky tests. The bane of every developer’s existence. They pass, they fail, and there’s no rhyme or reason to it. These are incredibly damaging because they destroy confidence in your CI/CD pipeline. Pretty soon, developers start ignoring legitimate failures because they just assume “it’s that flaky test again.”
The moment you suspect a test is flaky, you need to pounce on it.
Your first move is to isolate the problem. Run that specific test on a loop and see if you can consistently reproduce the failure. From my experience, the culprits are usually one of these:
- Race Conditions: The test relies on async operations finishing in a certain order, which isn’t guaranteed.
- External Dependencies: Your test is hitting a real network or database instead of a predictable mock. Big no-no.
- Order Dependence: The test only works if another, unrelated test ran just before it, setting up some hidden global state.
Once you’ve found the root cause, fix it. Improve your async handling, shore up your mocks, or refactor the test to be completely self-contained. If you can’t fix it immediately, disable it and create a high-priority ticket. Just don’t let it linger in your test suite.
Untangling Unit Tests vs. Integration Tests
It’s easy to get these two mixed up, but they serve very different purposes.
Unit tests are all about isolation. You’re putting a single function or component under a microscope. To do this, you mock out every single dependency—every prop, every API call, every external module. The goal is to verify that this one tiny “unit” of code does its job correctly on its own.
Integration tests, as the name implies, are about how those units work together. Does your login form correctly call the authentication service, which then updates the global user state? That’s an integration test. You’re checking the connections and interactions between different parts of your app.
You absolutely need both. They give you complementary, not competing, views into your application’s health.
Ready to stop guessing and start knowing? CodePushGo offers powerful dashboards that transform raw test data into clear, actionable insights. You can visualize your React Native unit test results, track success rates over time, and spot flaky tests before they derail your team.